Monday, August 26, 2013

What is Hedging?


Simply put, Hedging is making an investment to reduce the risk. 

Businesses can hedge their risks by using forward contracts, customer over-the-counter derivatives, and futures contracts, like dual-entry accounting, hedging always has two side-a cash market component and a future position component. We therefore speak of firms being ‘long’ or ‘short’ in their cash market position just like we speak of firms being long or short in their hedged position.


An example of a hedge would be a retail chain that buys men’s suits from European designers, hedging against a rising exchange rate (Dollar falling against the Euro).

Thursday, August 22, 2013


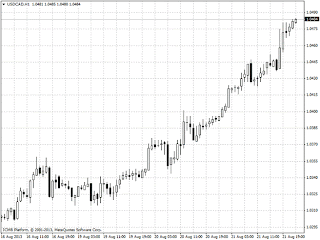
The U.S. dollar rose to six-week highs against the Canadian dollar on Wednesday, ahead of the keenly anticipated release of the minutes from the Federal Reserve’s latest policy 
High impact Data’s of USD like Core Retail Sales can change the scenario. Core Retail Sales is the A measure of total retail sales, excluding auto and gas sales, which are excluded due to their volatility  based on data collected by the Commerce Department.  the core retail sales data is an important indicator about the health of the overall economy.
The Core Retail Sales Data will be released at 8.30am USA time. Do not miss it out!

Friday, August 2, 2013

Most Profitable Indicator

Traders do not include these indicators just to make their charts look nicer. Traders are in the business of making money! 

If these indicators generate signals that do not translate to a profitable bottom line over time, then they are simply not the way to go for your needs!

In order to give comparison of the effectiveness of each indicator, below is the chart for the Indicator and rules.


Indicator
Rules
Bollinger Bands
Cover and go long when daily closing price crosses below lower band
Cover and go short when daily closing price crosses above upper band
MACD
Cover and go long when MACD1 (fast) crosses above MACD2 (slow)
Cover and go short when MACD1 crosses below MACD2
Parabolic SAR
Cover and go long when daily closing price crosses above ParSAR
Cover and go short when daily closing price crosses below ParSAR
Stochastic
Cover and go long when Stoch %K crosses above 20
Cover and go short when Stoch %K crosses below 80
RSI
Cover and go long when RSI crosses above 30
Cover and go short when RSI crosses below 70
Ichimoku Kinko Hyo
Cover and go long when conversion line crosses above base line
Cover and go short when conversion line crosses below base line


Successful Forex trader does not mean trade using so many indicators in their platform. You just pick 1 - 3 the most profitable indicator and use them in your trading activity. 

Your goal should be to find the most profitable indicator to determine entry and exit level when trading. In this article, I show you the most profitable indicator in Forex world.


For more details about Forex Trading with ICM Brokers, please click the link: www.ICMBrokers.com and feel free to access our product and services that can help you easily to trade.